

Title: Visualizing vibrational normal modes of a single molecule with atomically confined light
Authors: Joonhee Lee, Kevin T. Crampton, Nicholas Tallarida & V. Ara Apkarian
Journal: Nature
Year: 2019
Researchers from the University of California, Irvine implemented a technique to visualize a molecule in its vibrational motion.
Every time we attend a Chemistry class, we learn that molecules can move in different ways: they can translate (all the atoms move in the same direction), rotate and also vibrate (in this case the bonds between the atoms behave as springs). All these movements can be detected when the molecule interacts with light of different wavelength ranges, by absorbing or emitting it (Figure 1). This technique is called spectroscopy!
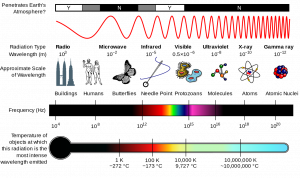
Figure 1: Electromagnetic spectrum and its sources. Inductiveload, NASA [CC BY-SA 3.0]
As chemists, we use spectroscopy to study these movements and answer fundamental questions about a molecule, such as its geometry or how the atoms are bound together. In vibrational spectroscopy (both infrared and Raman), the interaction between the molecule and the light provides information on the frequency of the bond vibrations which is useful for structure identification.
Raman spectroscopy looks at the energy that the light (typically in the visible range) loses following interaction with matter (this phenomenon is called Raman scattering), but the technique is not too sensitive in principle (it needs a concentrated sample to give a good signal). During the years, it has been improved to reach a very high sensitivity. Surface-enhanced Raman spectroscopy (SERS) enhances (of a factor of 1010) the Raman scattering when the molecule is adsorbed on a metal surface allowing the detection of single molecules.
SERS enhancement is confined to a small spatial region, called a hotspot. Moving the hotspot is key to attain a Raman spectrum of the whole molecule.
In this study, SERS is combined with scanning tunneling-microscopy (STM) to push the resolution to an even smaller scale (similar to molecular bonds) and visualize a single cobalt porphyrin vibrating.
STM exploits quantum tunnelling of electrons between the silver microscope tip and a surface that is being examined when a voltage difference is applied between the two. STM can already image individual atoms within a material. Thus, the use of STM as a tip for SERS allows the acquisition of this Raman shift with an even higher resolution.
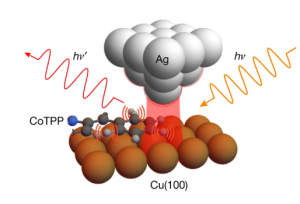
Figure 2: Silver STM tip creating the hotspot for SERS on a Co porphyrin. (Adapted by permission from Springer Nature Customer Service Centre GmbH: Springer Nature, Nature, Visualizing vibrational normal modes of a single molecule with atomically confined light, Joonhee Lee, Kevin T. Crampton, Nicholas Tallarida & V. Ara Apkarian, (2019))
The researchers anchored the porphyrin to a copper surface and carried out the experiment at 6 K in ultrahigh vacuum (Figure 2). They recorded different Raman spectra while moving the tip of the microscope (of only a few Angstroms) across the molecule. When the tip was close enough to an atom taking part into a vibrating bond, Raman scattering was observed. By analysing all the spectra, they were able to recognize the atoms involved in the vibrations and reconstruct the full vibrational movement (Figure 3).
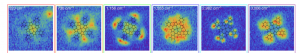
Figure 3: Reconstructed experimental maps of the vibrational motions of the porphyrin. (Adapted by permission from Springer Nature Customer Service Centre GmbH: Springer Nature, Nature, Visualizing vibrational normal modes of a single molecule with atomically confined light, Joonhee Lee, Kevin T. Crampton, Nicholas Tallarida & V. Ara Apkarian, (2019))
With this technology, we are now able to look at a film of a single molecule in movement. Going so low in resolution and so deep into the vibrational motions opens a new world of possibilities for structural analysis and spectroscopy in general. I cannot wait for what is next!