
Title: “Fires reverse progress toward ozone air quality standards in the United States.”
Authors: Weizhi Deng, Jun Wang, Meng Zhou, Xi Chen, Xiaodong Wu, Huanxin Zhang, Jason B. Cohen, Jing Wei, Arlindo Da Silva, Guy P. Brasseur, Claire Granier, Laurence Rouil.
Year Published: 2026
Journal: Science
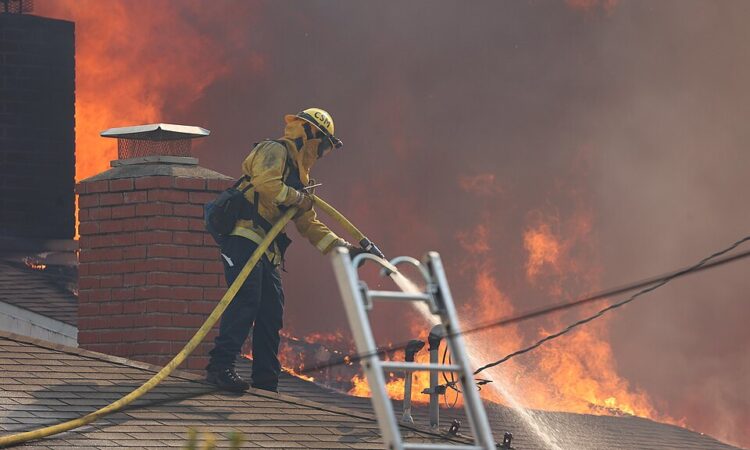
The destruction caused by wildfires often feels obvious. Front of mind are images of burning houses, charred forests, and blackened skies. However, wildfires also contribute to threats that are invisible to the naked eye.
Ozone (O3) is a molecule that many may associate with the ozone layer, a region in Earth’s stratosphere (~10-50km above the earth’s surface) that protects us from harmful UV irradiation. Here, when ozone is bombarded with a high-energy UV photon, it splits into atomic oxygen (O) and molecular oxygen (O2). Because atomic oxygen can recombine with molecular oxygen to reform ozone, a balance is maintained and the UV radiation is prevented from reaching the surface of the earth.
But it lives a double life – because of its high oxidative potential, ozone is deleterious to human health, and when present in the atmospheric boundary layer (the region of high turbulence above the Earth’s surface), it can cause adverse respiratory symptoms and increased morbidity.

Chemical Structure of Ozone (Д.Ильин: vectorization, CC0, via Wikimedia Commons)
Broadly speaking, surface ozone concentrations have been decreasing in the past decades due to global efforts to limit harmful emissions. However, a recent study led by scientists at the University of Iowa and NASA Goddard Space Flight Center uncovered a concerning reversal of this decades-long trend in air quality improvement, and they think wildfires are to blame. In their billowing plumes of smoke, wildfires emit nitrogen oxides (NOx = NO + NO2) and volatile organic compounds, which when irradiated with sunlight, react to form ozone.
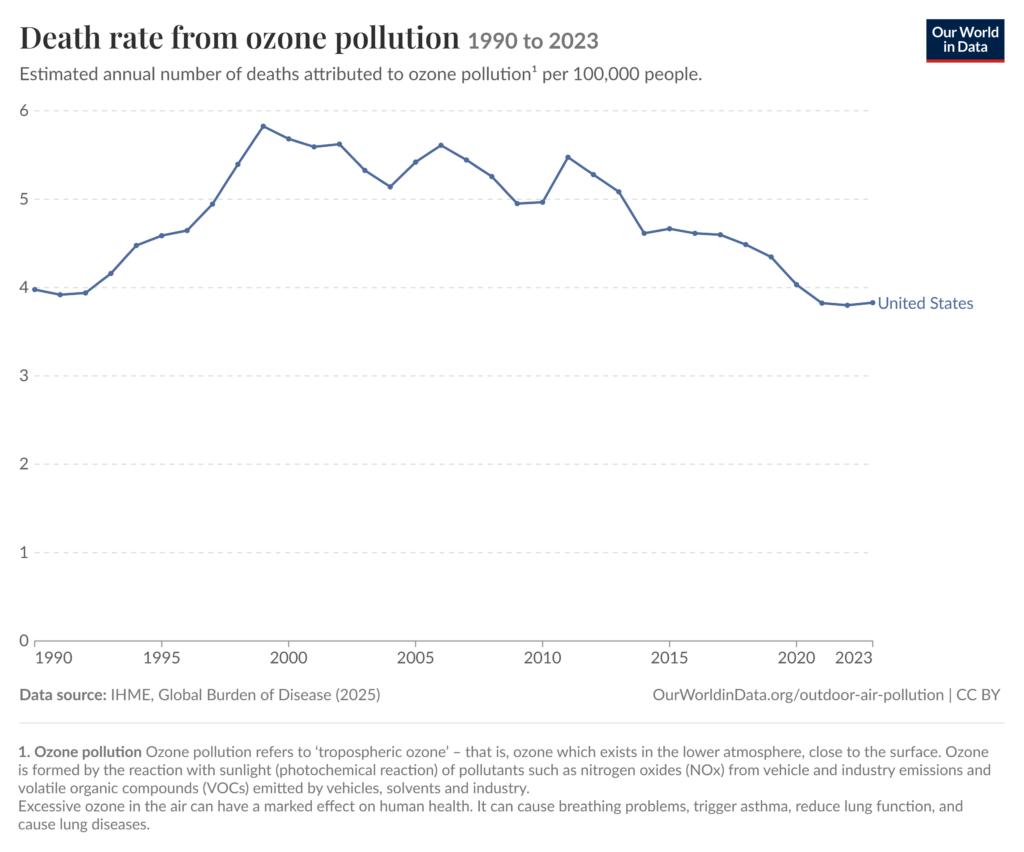
Most trends in policy-relevant ozone levels and associated mortality indicate a decrease in ozone-related deaths, as shown above. However, Deng et al. (2026) argue that these trends fail to account for ozone generated by wildfires. (“Data Page: Death rate from ozone pollution”, part of the following publication: Esteban Ortiz-Ospina and Max Roser (2016) – “Global Health”. Data adapted from IHME, Global Burden of Disease. Retrieved from https://archive.ourworldindata.org/20260910-004756/grapher/death-rate-from-ozone-pollution-gbd.html [online resource] (archived on September 10, 2026)).
The majority of the continental US (CONUS) is underserved by the US Environmental Protection Agency’s (EPA) air quality monitoring network, with monitoring stations covering a meagre 2% of the land area, which accounts for roughly one quarter of the population and leaves many rural or hard-to-reach populations unmonitored. Because of this, efforts to model ozone concentrations are not always as precise as we’d like them to be. The authors report that the current benchmark modelling efforts only explained about half of the total variability in maximum daily O3 concentrations, and they tend to flatten the peaks and troughs of the data, failing to account for extremes in ozone behaviour.
To address this gap, the authors trained a type of artificial neural network called a multilayer perceptron (MLP) deep learning model to estimate the effect of wildfire smoke on ozone concentrations. They trained the MLP using the maximum daily 8-hour O3 average (MDA8) from the EPA among other inputs including surface concentrations for ozone and its precursor molecules. These values were taken from a chemical transport model constrained by real emission and satellite data. Once trained, the model was applied across more than two decades of MDA8 estimates (2003-2024).
To disentangle the effect of wildfires from other ozone-influencing variables, the authors isolated regions that were unaffected by fires to create a “no-fire” baseline from which they could compare their fire-influenced data. They also used a chemical transport model simulation to recreate data with and without fire emissions. Both methods yielded the same results, confirming the validity of their methods.
What they found was cause for concern. Before 2015, decreases in anthropogenic pollution and emissions led to a decrease in surface ozone concentrations, with the three-year running average of annual fourth-highest MDA8 dropping by approximately 5-10% nationwide. This trend was consistent, both when including and excluding fires. However, after 2015, the trend reversed for fire-inclusive data, and ozone concentrations started to climb again. In the “no-fire” case, ozone concentrations continue to decline (albeit, at a slower rate), which suggests that fires are the driver for this change. This change was not captured by the original EPA monitoring stations, in part because of their geographic bias away from inland locations where this trend is enhanced.
Perhaps most alarmingly, the authors propose that mortality due to ozone exposure has increased by almost 50% since 2013, which accounts for over 300 excess deaths per year, nationally. The deadliest year was 2023, during which the authors attributed almost 8000 deaths to ozone exposure, nationally.
The authors reassert that the observed reversal of the decline in surface ozone concentrations may be an opportunity to reevaluate the existing standards surrounding air quality in the US. They point out that the World Health Organization (WHO) currently recommends a guideline of 50 parts per billion (ppb), while the EPA allows 70 ppb, and categorizes wildfires as exceptional natural events to be excluded from normal consideration. However, with summer becoming increasingly associated with the characteristic orangey haze of smoke-affected skies, it may be time to reassess these guidelines to better serve the estimated 43 million Americans living in areas that exceed recommended ozone concentrations.

