
Title: Molecular Origin of Blood‐based Infrared Spectroscopic Fingerprints
Authors: Liudmila Voronina, Cristina Leonardo, Johannes B. Mueller-Reif, Philipp E. Geyer, Marinus Huber, Michael Trubetskov, Kosmas V. Kepesidis, Jürgen Behr, Matthias Mann, Ferenc Krausz, Mihaela Žigman
Journal: Angewandte Chemie
Year: 2021
All figures reprinted with permission from Voronina et al. 2021, Angewandte Chemie. Cover image by fernando zhiminaicela from Pixabay.
Normally, to determine whether a tumour is cancerous, you need to take a tissue biopsy. Tissue biopsies are very reliable as a diagnostic tool, but the procedure can be painful and invasive for patients. In some cases, depending on where the tumour is located, it’s not possible to take a biopsy sample to test at all. Blood tests can provide an alternative, less invasive method for early detection and diagnosis of cancer through identifying cancerous DNA in the bloodstream. This also means that the cancer can be tracked easily and frequently throughout treatment, giving insights into whether a specific treatment is working. However, detecting very low concentrations of DNA from cancer tumours in the blood can be very difficult, and limits the accuracy of the tests. To address this, Žigman and co-workers have developed a new method for diagnosing lung cancer from a blood test.
To do this, the researcher opted to use infrared spectroscopy to visualise a “fingerprint” of what the blood of a healthy person looks like compared to a lung cancer patient. Infrared spectroscopy is a technique that can be used to determine the structural components in a molecule or mixture of molecules. Different types of bonds will absorb specific frequencies in the infrared (heat) spectrum, and these characteristic absorptions can be used to determine which structures are present. The main advantages it has over other analytical methods is that it is relatively cheap, fast, and simple to use.
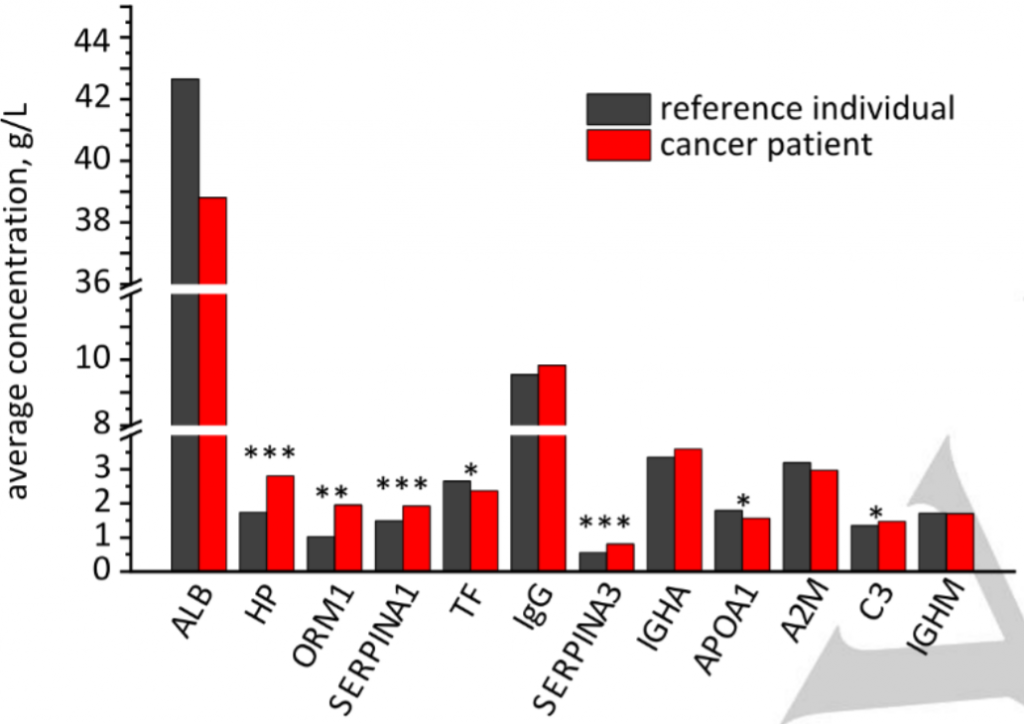
Blood contains a mixture of many different proteins, and previous work has shown that the concentrations of certain proteins in the blood change in lung cancer patients. This pattern of changes can be detected by infrared spectroscopy and used to diagnose lung cancer. To better understand these changes, the researchers used proteomics to detect the major protein components found in the blood of healthy reference individuals and how these differed from lung cancer patients. They tested the 10 most common proteins found in the blood of healthy individuals, plus another two which showed very large differences between the healthy reference group and the cancer patients. These 12 proteins and their relative levels between the two groups are shown below in Figure 1. Through statistical analysis, the researchers found that seven of these proteins were significantly different in the blood of cancer patients compared to the reference group. These seven proteins are marked with asterisks in Figure 1.
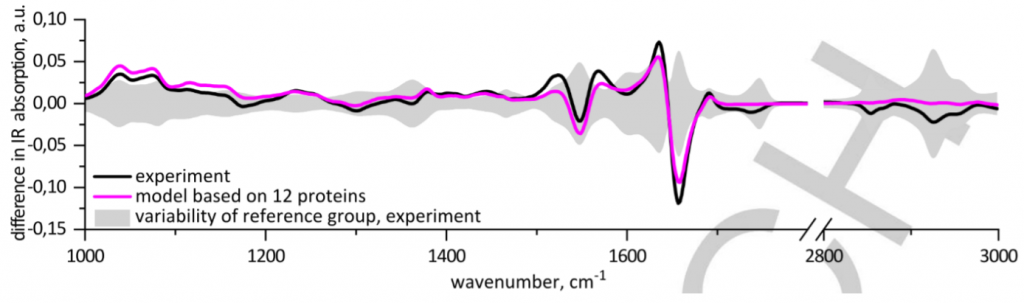
Once they had determined the major proteins in the blood and their differences in concentrations, the researchers sought to match this with data from infrared spectroscopy. By comparing the infrared spectra of blood from the reference group compared with lung cancer patients, they were able to determine a pattern of differences in the peaks they could use for diagnosis. Using a pattern of changes has two main advantages – it is more reliable than using a single biomarker as a diagnostic tool, and machine learning algorithms can also be trained to recognise and associate a specific pattern with a specific disease. The black line in Figure 2 shows the deviation from the reference sample average. (If the reference group was represented on this plot, it would be a straight horizontal line through the middle, as it has no deviation from itself). The shaded area shows the variability between individuals in the healthy reference group. The researcher found that there were several peaks that were statistically different in lung cancer patients compared to the reference group which could be used to differentiate between the two groups.
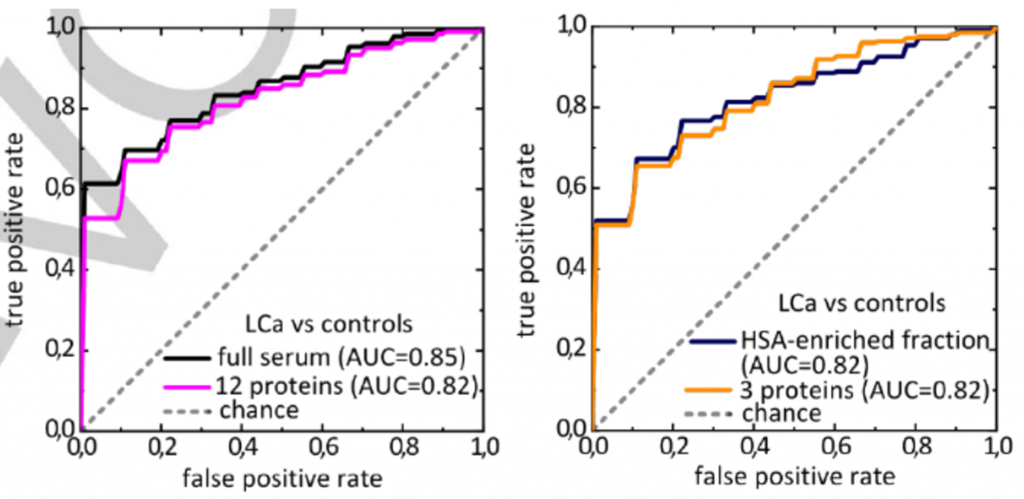
In addition to using full serum, the researchers also extracted the blood into three samples: the metabolite fraction (1), and fractions which were enriched (2) and depleted (3) with human serum albumin, one of the most common proteins found in blood. These different fractions allowed them to see smaller peaks in the infrared spectra which would otherwise be obscured by larger peaks. Statistically significant differences were also found in the human serum albumin-enriched and depleted fractions of blood, which again adds to a pattern of differences that can be used to differentiate between healthy individuals and lung cancer patients. The researchers then created receiver operator characteristic curves, which are used to determine the diagnostic ability of binary systems, such as positive and negative. The closer the curve gets to the top left-hand corner, the better the diagnostic ability. Figure 3 shows the receiver operator characteristic curves for both full serum (left plot) and the human serum albumin-enriched fraction (right plot). These curves demonstrated that the pattern of changes detected by infrared spectroscopy was very good as a diagnostic tool for differentiating between healthy individuals and cancer patients.
The researchers hope that by determining the IR fingerprint of lung cancer, they can provide a fast, cheap, and reliable tool for early diagnosis. Early detection is a key factor that improves outcomes for cancer patients, making it critical for treatment. They also suggest that this method could be applied to other diseases to create a database. Using this database, algorithms could be trained to recognise specific patterns associated with different diseases. There’s still a lot of work that needs to be done to create this database – a reproducible and distinct pattern of changes in the infrared spectrum would need to be determined for each individual illness. But, if we can determine these patterns, we can create a powerful diagnostic tool which can differentiate between many different diseases using only a simple blood test.