
Title: Machine Learning Classifies Ferroptosis and Apoptosis Cell Death Modalities with TfR1 Immunostaining
Authors: Jenny Jin, Kenji Schorpp, Daniel Samaga, Kristian Unger, Kamyar Hadian, and Brent R. Stockwell
Year: 2022
Journal: ACS Chemical Biology
DOI: https://doi.org/10.1021/acschembio.1c00953
Featured image by Alex Ritter, Jennifer Lippincott Schwartz and Gillian Griffiths, National Institutes of Health
As living organisms grow and develop, they undergo many processes and of importance is cell death. It helps shape organs, develop bodies, and makes sure that specialized cells are generated in the right places. When cells are misplaced, the body activates mechanisms to get rid of them, so the organisms keep running things smoothly. Therefore, the body has no choice but to regulate it closely, and it does so by two widely known methods:1) apoptosis, in which the cell dies in a ‘healthy’ manner without inducing a disease state and 2) necroptosis, where cells death releases toxic substances causing disease progression. However, there is another type of cell death, recently discovered – ferroptosis where the cell dies based on the lipid peroxide accumulation due to iron (hence ferro).
Researchers have identified that ferroptosis doesn’t occur in cancer, degenerative diseases and organ injury, and so cell death by ferroptosis holds promise as a possible target for unexplored treatments. But how does one know if a cell is dying of apoptosis, ferroptosis, or necroptosis and why is this important? If we identify the method by which cells refuse to die when they are in a diseased state then, we could potentially find ways to force cell death thereby reducing symptoms or finding possible cures. Thus, knowing the cell death mechanism becomes essential in this regard.
To identify ferroptosis, researchers focus on a protein called transferrin receptor 1 (TfR1). This protein is important in this cell death process because it helps increase the concentration of iron, initiating ferroptosis. TfR1 is stained with a fluorescent antibody so, upon ferroptosis, these molecules can be observed near the membrane when imaged. Nonetheless, this is a visual tool, which involves bias, also, it is slow. Jin et al developed a machine learning method to analyze and distinguish multiple florescence images to find out if cells were dying by ferroptosis (indicated by the TfR1 marker) or apoptosis. This technique reduces bias, eliminates subjective manual process, and makes analyzing the images a high throughput process.
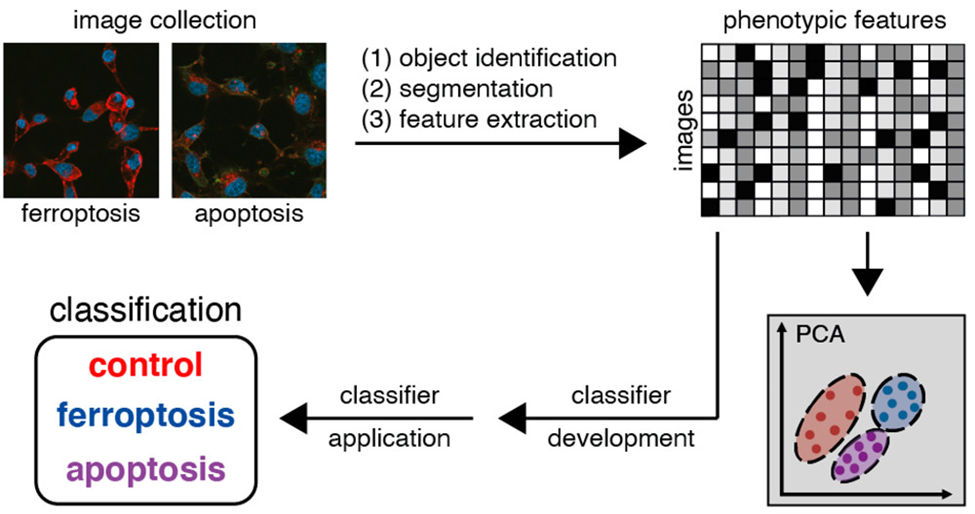
The general methodology (Fig 1) is to collect multiple images from sets of untreated cells, cells treated with ferroptosis inducer, and cells treated with apoptosis inducer. These are all stained to detect TfR1 (ferroptosis marker) and proteins indicating physical features of the nucleus and the cytoplasm, when they fluoresce in red, blue or green colors. Staining TfR1 tells us which cells die by ferroptosis while the staining of other proteins gives cellular information like shape, symmetry of organelles, texture and structure of the cell. Once these images are collected, the machine learning model was built by feeding all the information. The model considered the brightness of the fluorescence signals, the shape of the cell, nucleus and the texture of the signal to classify the cellular features into ferroptosis induced death (indicated by the TfR1 stain) or apoptosis induced death. The building of the model is described in detail below.
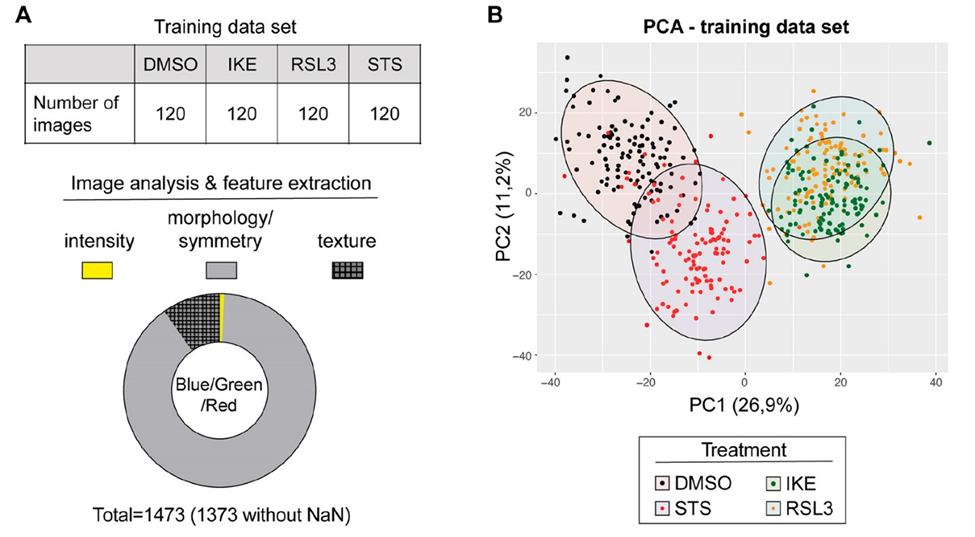
The images obtained were described by around 1400 features (parameters). On analysis of these features, they found that the number of nuclei, their fluorescence intensity and roundness were most frequent, but the classification between apoptosis, ferroptosis and control samples could not be established (Fig 2A). Therefore, to refine their methodology, they removed all features with unknown values, as they contributed no information. To reduce features further, a principal component analysis (this indicates the variance in the samples and tends to group samples) was done. It revealed that ferroptosis-mediated cell death grouped different from apoptosis-mediated cell death (Fig 2B), indicating that the staining and analysis worked. The mentioned model was built on this reduced number of features. After several steps of building and optimizing, Jin et al. reduced the set of features to 23, each of which had biological meanings for the proteins such as location in the cell, proximity to membrane, radius, texture, intensity etc. Once the model was trained, they collected another set of samples and images and ran the analysis to test their model. The model’s objective was to classify which cells were dying of ferroptosis and which of apoptosis. The accuracy of this classification was 93%.
The model not only attains high levels of accuracy for cell death classification, but it is also able to differentiate textures between ferroptosis and apoptosis. Correlating such results with other observations will allow us to generate detailed signature patterns to recognize cell death mechanisms, which are not feasible through the human eye.
Although this study only analyses ferroptosis, it provides a starting point for machine learning biology to contribute to treatments. It reduces bias and generates algorithms to detect different death types, while also making it high throughput (by analyzing multiple images at a time). This is just the starting, and soon we can see it being used to classify cell types, or aid in prediction of cell alterations in disease states. This will pave way generating hypothesis and experiments to enlighten us on pathways too!