
Title: Terpene Synthases and Terpene Variation in Cannabis sativa
Authors: Judith K. Booth, Macaire M.S. Yuen, Sharon Jancsik, Lufiani L. Madilao, Jonathan E. Page, Jörg Bohlmann
Journal: Plant Physiology
Year: 2020
Featured image by Lindsay Fox is licensed under CC BY 2.0 by Creative Commons.
As medicinal cannabis becomes more accessible, and recreational cannabis use is decriminalized, more people are making use of its many properties. While many are familiar with tetrahydrocannabinol (THC) as the main psychoactive component of cannabis, terpenes also play an important role in cannabis flavor profiles. Terpenes are hydrocarbon-based compounds formed by enzymes known as terpene synthases (TPSs). They are highly variable compounds; as of 2021, over 80,000 have been characterized1. One example of a well-known terpene is menthol, derived from the monoterpene (C10) limonene and used in many everyday products, including gum and cough drops2,3. Monoterpenes as well as sesquiterpenes (C15) are highly prevalent in cannabis and contribute heavily to its flavor and fragrance. However, the terpene content of different cannabis strains is often unknown, making it difficult to identify and curate specific flavors and fragrances in different cultivars. In this study, Booth et al. combat this shortcoming by characterizing the terpene profiles of various cannabis strains using techniques such as principal components analysis (PCA) and RNA-seq, broadening our knowledge of terpene-content in known cannabis strains.
The authors begin by characterizing the cultivar Purple Kush (cv PK) to use as a baseline for TPS content in cannabis to compare to additional strains. Because proteins with similar DNA sequences generally have similar functions, computational programs such as tBLASTn can be used to predict unknown gene function by comparison of protein sequences to genes with known functions. In cv PK, a total of nineteen putative TS genes were identified, as well as other genes related to terpene and cannabinoid biosynthesis.
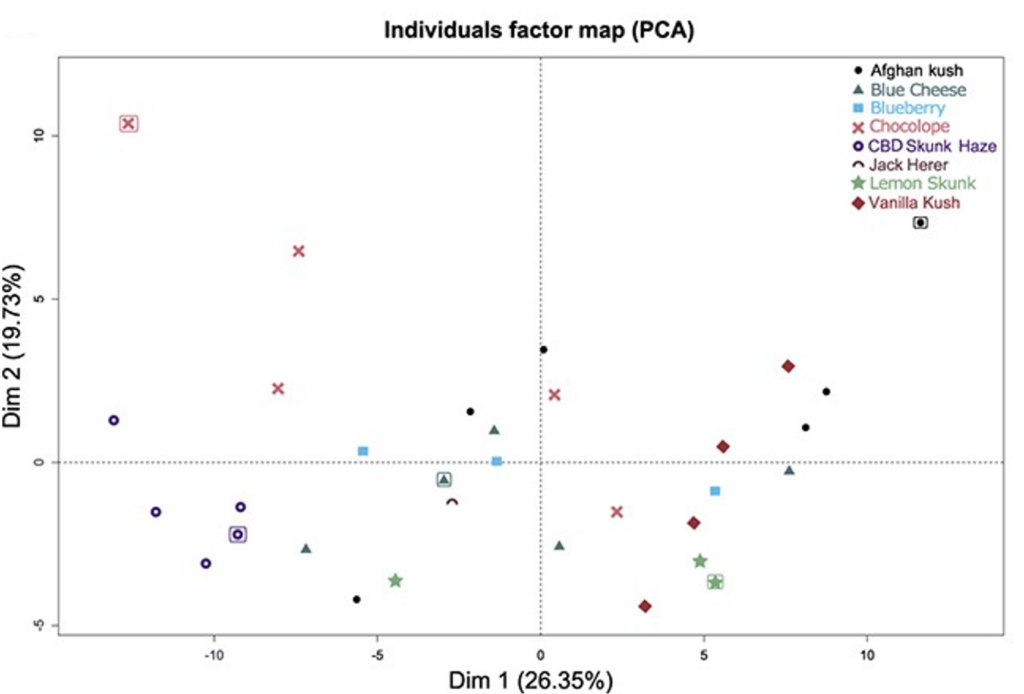
Next, eight additional cannabis strains – cv Lemon Skunk (LS), cv CBD Skunk Haze (CSH), cv Blue Cheese (BC), cv Afghan Kush (AK), cv Chocolope (Choc), cv Blueberry, cv Vanilla Kush, and cv Jack Herer – were cultivated from seeds and analyzed for their terpene content via gas chromatography (GC) paired with mass spectrometry (MS). Gas chromatography separates different compounds based on factors such as vapor pressure; in a nutshell, compounds with lower boiling points will vaporize earlier and thus elute sooner than compounds with higher boiling points. This is an ideal separation technique for terpenes as they are readily vaporized. As different compounds in a sample are separated, each compound is subjected to a mass detector for determination of the molecular weight and identification of the compound. Using GC/MS, 48 different terpene profiles were extracted and identified from the leaves of the eight different strains. Out of these 48 compounds, only five were present in every strain, highlighting the diversity of terpenes produced by different strains. To investigate the variability of terpenes produced by each strain, PCA was performed. In this experiment, the authors focus on the top two components responsible for the first and second-most variability between strains. In short, a PCA plot tells us two things: how similar each data point is to all the others and how similar individual points are to the whole data set. In Figure 1, each data point represents the terpene profile of one plant; thus, the closer two points are, the more similar their terpene content. Furthermore, the closer a data point is to the axis (Dim1 or Dim2), the less variable it is; in this case, less variable implies the terpene profile does not include unique terpenes and instead includes terpenes produced by others in the data set. Based on the PCA results, the authors chose five plants for further cultivation and analysis: one highly variable plant from each quadrant and one plant toward the center of the plot (i.e. has a terpene profile very similar to the other plants) to maximize the number of different terpenes characterized in the study. It is important to note the PCA plot also highlights the inherent diversity even within plants of the same strain, again underlining the need for characterization of terpene profiles in cannabis for more accurate and consistent plant growth and selection.
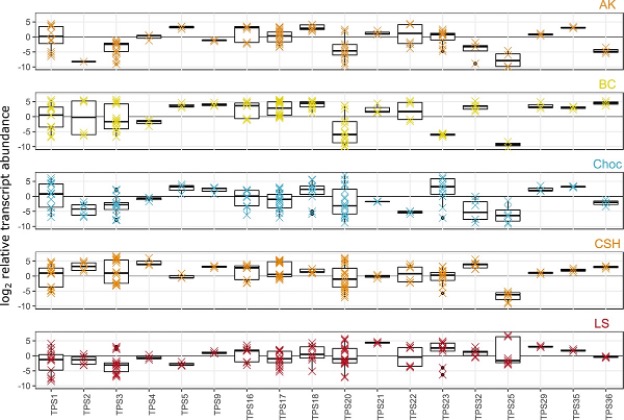
The five strains chosen based on PCA (cv AK, cv BC, cv Choc, cv CSH, and cv LS) were further cultivated and grown to induce flowering to analyze terpene content in both plant leaves and flowers. While overall terpene content of plant leaves versus flowers was consistent within strains, they found that terpene quantity was much higher in flowers. They also observed that while foliar terpene content was dominated by sesquiterpenes, the terpene content of flower varied with age, and monoterpene content increased with time (Figure 2). Ultimately, 15 monoterpenes and 27 sesquiterpenes were identified from mature flowers of these strains, the most abundant of which include monoterpenes such as myrcene, α-pinene, and limonene, and sesquiterpenes such as β-carophyllene and β-farnesene.
Because not all genes in an organism may be active at once, RNA-seq is an ideal method for identifying genes which are actually “turned on,” giving more insight into what compounds are being produced. If a gene coding for a protein which produces limonene is highly expressed, it is likely limonene is produced in high yield. RNA-seq was completed on each of the five strains to reveal eighteen active CsTPS genes which correspond to both known and unknown terpene synthases. RNA-seq is an ideal technique for quantifying the expression of the same gene in different strains; for example, the gene TPS25 is poorly expressed in cv BC, but much more highly expressed in cv LS, although with high variability, as shown by the box plot in Figure 2. This gene was shown in vitro to catalyze β-farnesene biosynthesis, thus we can anticipate cv LS will produce much more β-farnesene than cv BC.
Ultimately, these techniques are just a few that can be used to identify and compare terpene content in different cannabis strains. Increasing our understanding of TPS variance in different strains will simplify cultivation of specific flavor profiles in cannabis.
References
(1) Dictionary of Natural Products 30.2. https://dnp.chemnetbase.com/faces/chemical/ChemicalSearch.xhtml.
(2) Booth, J. K.; Yuen, M. M. S.; Jancsik, S.; Madilao, L. L.; Page, J. E.; Bohlmann, J. Terpene Synthases and Terpene Variation in Cannabis sativa. Plant Physiology. 2020, 184 (1), 130–147. https://doi.org/10.1104/pp.20.00593.
(3) Chen, F.; Tholl, D.; Bohlmann, J.; Pichersky, E. The family of terpene synthases in plants: a mid-size family of genes for specialized metabolism that is highly diversified throughout the kingdom. The Plant Journal. 2011, 66 (1), 212–229. https://doi.org/10.1111/J.1365-313X.2011.04520.X.